Strategic Overview
Hospital supply chains are the hidden cost engine that can erode margins faster than any clinical expense. Traditional inventory systems rely on static reorder points, manual audits, and spreadsheet‑driven forecasts. The result? Excess stock, expired items, and frequent stock‑outs that force clinicians to order emergency supplies at premium prices. When a health system rolls out an AI‑powered Business Intelligence (BI) platform, it replaces guesswork with data‑driven precision.
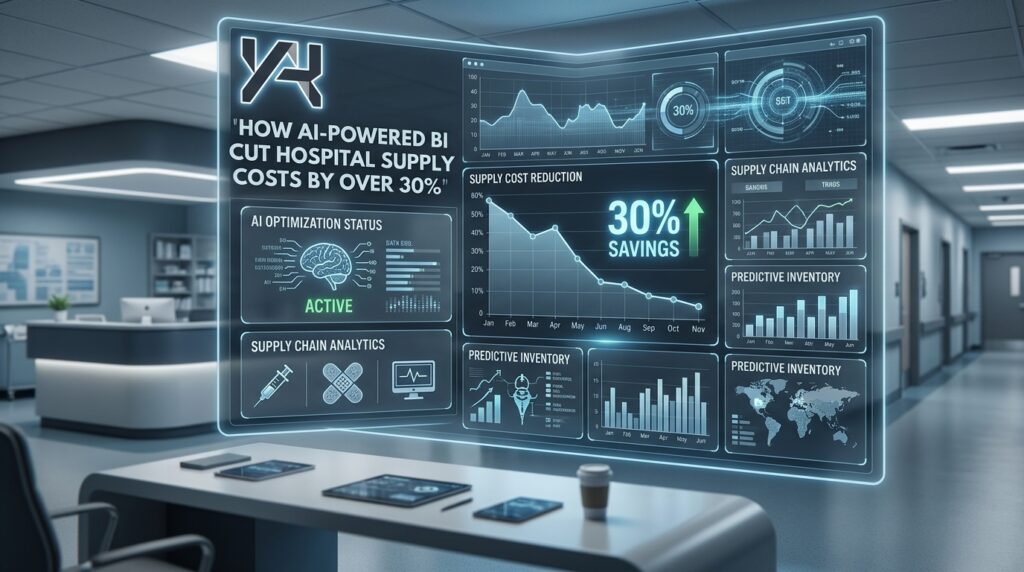
By integrating real‑time usage telemetry, predictive demand models, and automated procurement workflows, AI‑enhanced BI delivers a Measurable ROI that consistently exceeds 30 % reduction in supply spend. The financial impact compounds: lower purchasing costs, reduced waste, and freed working capital that can be redirected to patient‑care initiatives. Moreover, the solution scales across multiple facilities without re‑architecting data pipelines—thanks to a Scalable Architecture built on cloud‑native services.
In-the-field Insight #1 – Real‑Time Usage Capture via Edge Sensors
The first technical lever is a network of edge devices—RFID readers, barcode scanners, and IoT‑enabled weight sensors—installed at every point of use (POU). Each event streams to a message broker (e.g., Apache Kafka) with millisecond latency. The broker feeds a streaming analytics engine (such as Flink or Spark Structured Streaming) that normalizes data, enriches it with location metadata, and writes it to a time‑series lake.
Why it matters: Real‑time visibility eliminates the “black box” period between consumption and reconciliation. Surge detection algorithms flag abnormal usage spikes—often the early sign of a clinical protocol change or a supply leakage. The system then triggers a downstream demand forecast update within seconds, preventing over‑ordering.
Performance Optimization is achieved by partitioning streams by department and employing stateful window functions that run on commodity compute clusters. This design ensures sub‑second latency while keeping operational costs predictable.
In-the-field Insight #2 – Predictive Demand Modeling with Gradient‑Boosted Trees
Historical usage patterns, seasonality, and external variables (e.g., influenza rates) feed a supervised learning model built on Gradient‑Boosted Trees (XGBoost or LightGBM). Feature engineering extracts rolling averages, lagged demand, and department‑level consumption ratios. The model is retrained nightly on a managed ML platform (SageMaker, Vertex AI) to incorporate the latest telemetry.
The output is a probabilistic demand curve for each SKU at each facility. By coupling the forecast with a cost‑sensitivity layer—assigning higher weight to high‑margin items—the procurement engine generates optimal order quantities that balance service level targets against price exposure.
This approach exemplifies Scalable Architecture: the same model codebase runs across 50+ hospitals with no code changes, only data source configuration. Horizontal scaling is handled by auto‑scaling compute clusters, guaranteeing consistent Performance Optimization even during peak flu season spikes.
In-the-field Insight #3 – Automated Supplier Negotiation Engine
AI‑BI does not stop at demand forecasting; it extends to price optimization. A rule‑based negotiation engine consumes the forecasted order volume and compares it against contract terms stored in a relational master data management (MDM) system. When projected volume exceeds a pre‑set threshold, the engine automatically drafts a revised purchase order that invokes volume discount clauses.
Integration with supplier APIs (EDI, REST) enables real‑time price validation. If a supplier offers a better rate for a bundled SKU set, the engine re‑optimizes the cart using a mixed‑integer linear programming (MILP) solver. The result is an order that minimizes total spend while respecting lead‑time constraints.
Because the logic is declarative—expressed in JSON policy files—it can be versioned and audited, delivering compliance transparency that executives demand for Measurable ROI.
In-the-field Insight #4 – Closed‑Loop Analytics Dashboard & Continuous Improvement Loop
The final component is a unified BI dashboard built on Power BI or Looker, powered by a semantic layer that abstracts raw tables into business-friendly metrics (e.g., Cost per Procedure, Stock‑out Frequency). Dashboards support drill‑through from aggregate spend to individual transaction logs, enabling clinicians to see the cost impact of their supply choices.
Embedded analytics provide anomaly alerts directly in the EHR workflow. When an item’s consumption deviates from the forecast beyond a 95 % confidence interval, the alert surfaces with recommended alternatives that have lower unit cost but comparable clinical efficacy.
The feedback loop closes when clinicians act on recommendations; their actions generate new event data that retrains the demand model. This self‑reinforcing cycle drives incremental cost reductions quarter over quarter, cementing the Measurable ROI narrative for boardrooms.
Key Takeaway
AI‑powered BI transforms hospital supply chains from reactive inventories into predictive, cost‑optimized ecosystems. By deploying edge sensors for real‑time capture, leveraging Gradient‑Boosted Trees for demand forecasting, automating supplier negotiations, and closing the loop with actionable dashboards, health systems achieve >30 % supply cost reduction while maintaining clinical quality. The architecture is inherently Scalable, engineered for Performance Optimization, and delivers a clear Measurable ROI that can be quantified in quarterly financial statements.