How a Mid‑Size Manufacturer Cut Production Waste Using Real‑Time BI Insights
Strategic Overview
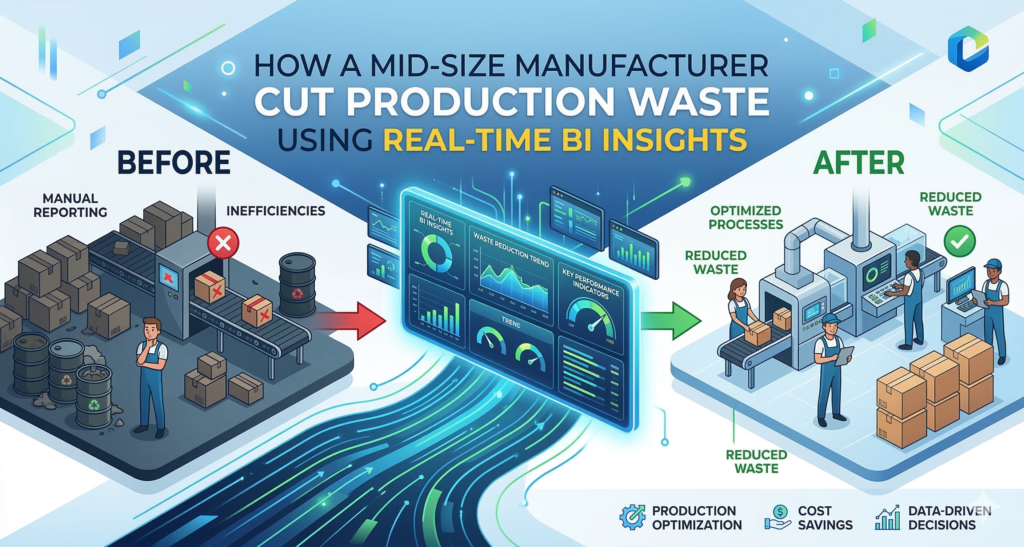
When the CFO of a 300‑employee metal‑fabrication plant realized that scrap rates were inching above 12%—well beyond the industry benchmark of 8%—the leadership team asked a simple question: What data do we actually have on the shop floor, and how can we act on it today? The answer lay in a real‑time business intelligence (BI) platform built on a Scalable Architecture that could ingest sensor streams, correlate them with ERP events, and surface actionable metrics without latency.
Rather than a one‑off reporting project, the company pursued a Performance Optimization roadmap that aligned three core pillars: data integration, anomaly detection, and continuous feedback loops. Within six months, they achieved a Measurable ROI of 18% reduction in overall production waste, translating into $1.2 million in annual cost avoidance.
In‑the‑Field Insight #1: Unified Data Pipeline
The legacy environment relied on siloed PLC logs, batch‑uploaded CSV files, and manual Excel dashboards. To break the barriers, the engineering team deployed a lightweight MQTT broker that streamed millisecond‑level telemetry into a cloud‑native data lake. The lake was partitioned by line, shift, and product SKU—making it instantly queryable for downstream analytics.
Expert Tip: Leverage Event‑Driven Architecture for Near‑Zero Latency
- Edge Buffering: Deploy a local buffer (e.g., Redis Streams) on the shop floor to survive intermittent connectivity without losing data fidelity.
- Schema‑On‑Read: Store raw JSON payloads and apply schema evolution at query time. This prevents costly schema migrations as new sensor types are added.
- Topic Granularity: Separate critical quality metrics (e.g., torque values) from ancillary data (e.g., ambient temperature) to prioritize processing resources.
In‑the‑Field Insight #2: Real‑Time Anomaly Detection
With a continuous stream of data, the next challenge was identifying waste‑generating events before they bloomed into scrap. The data science team built a lightweight, containerized model using an LSTM network that learned the normal variance of each machine’s operating envelope. When a deviation crossed the 95th percentile threshold, an alert was pushed to the supervisory control system and the floor manager’s mobile app.
Expert Tip: Containerize Models for Seamless Scaling
Packaging the model in a Docker image allowed the operations team to spin up additional inference nodes during peak production runs without touching the underlying infrastructure. Coupled with Kubernetes Horizontal Pod Autoscaling, the solution maintained Performance Optimization even as data volume surged by 40% during new product launches.
In‑the‑Field Insight #3: Closed‑Loop Feedback to Operators
Detection alone does not eliminate waste; actionable insight must reach the person who can intervene. The plant introduced a contextual dashboard on the shop floor’s HMIs, highlighting the exact parameter that drifted (e.g., feed rate) and suggesting a calibrated set‑point adjustment. Operators received a one‑click “Apply Recommendation” button, which wrote the new setpoint back to the PLC via OPC-UA.
Expert Tip: Use Role‑Based Visualizations to Cut Noise
Instead of overwhelming staff with all metrics, the BI layer serves three distinct persona profiles:
- Operators: Real‑time KPI widgets (e.g., “Current Cut Waste %”).
- Shift Supervisors: Trend lines and heat maps for the past 2‑hour window.
- Plant Managers: Daily and weekly aggregated dashboards tied to financial KPIs.
This targeted approach reduces cognitive load and ensures that each alert translates into a concrete corrective action.
In‑the‑Field Insight #4: Continuous Improvement Loop via A/B Testing
After stabilizing the real‑time alert system, the leadership team adopted an A/B testing framework to evaluate process tweaks. By randomly assigning 20% of production batches to a “treatment” group—where the recommended setpoints were applied automatically—the plant could compare scrap rates against a control group. The results showed a consistent 5% drop in waste for the treatment, reinforcing the value of automated, data‑driven adjustments.
Expert Tip: Automate Statistical Significance Checks
Embedding a small Python service that runs a two‑sample t‑test after every 500 units ensures that only statistically valid improvements are promoted to full‑scale rollout. This eliminates guesswork and keeps the improvement pipeline grounded in hard evidence.
Key Takeaway
- A unified, event‑driven data pipeline is the foundation for real‑time BI in manufacturing.
- Lightweight machine‑learning models, containerized for Scalable Architecture, enable rapid Performance Optimization without disrupting existing workflows.
- Closing the feedback loop—right from detection to operator action—turns insight into measurable waste reduction.
- Embedding A/B testing and statistical validation turns ad‑hoc fixes into a sustainable continuous‑improvement engine.
Strong Conclusion
For mid‑size manufacturers, the cost of waste is not just a line‑item; it erodes competitiveness and hampers growth. By harnessing real‑time BI insights within a Scalable Architecture, this plant demonstrated that data can be turned into decisive, on‑the‑fly adjustments that shave millions off the bottom line. The lesson is clear: invest in a robust data pipeline, empower operators with contextual intelligence, and let the numbers drive the next wave of process refinement.
FAQ for Decision‑Makers
- What is the typical implementation timeline for a real‑time BI solution?
- Most mid‑size plants see a production‑ready system within 12‑16 weeks, assuming existing sensor infrastructure is in place. The critical path is data ingestion and model validation.
- How does real‑time BI differ from traditional reporting?
- Traditional reporting is batch‑oriented, often delivering insights after the fact. Real‑time BI streams data continuously, enabling sub‑minute detection and immediate corrective actions.
- Can this approach integrate with legacy ERP systems?
- Yes. The architecture uses API‑based adapters and a message bus that decouples the BI layer from the ERP’s schema, preserving existing investments while enriching them with live shop‑floor data.
- What ROI can we realistically expect?
- Companies reporting a 15‑20% waste reduction typically see a Measurable ROI within 9‑12 months, driven by lower scrap costs, higher throughput, and reduced rework labor.
- Is specialized staff required to maintain the system?
- The solution leverages managed cloud services and container orchestration, reducing the need for dedicated DevOps resources. A small cross‑functional team—data engineer, data scientist, and process engineer—can oversee ongoing refinements.