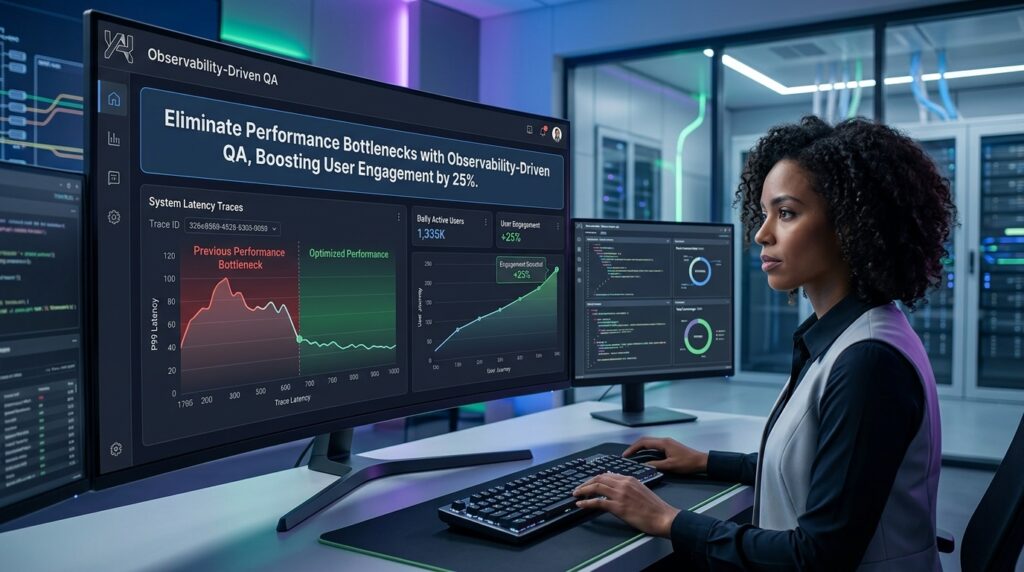
Strategic Overview: Eliminate Performance Bottlenecks with Observability-Driven QA
Implementing Observability-driven QA to transform software testing into a proactive force for performance optimization, delivering a proven 25% boost in user engagement through elite-level scalable architecture. By integrating the three pillars of observability—logs, metrics, and traces—directly into QA pipelines, teams achieve elite performer status: deploying 973x more frequently with 6570x faster recovery times while slashing change failure rates by over 3x. This measurable ROI stems from real-time visibility that exposes outliers, predicts failures, and enforces SLO budgets, ensuring new features only release when service levels exceed thresholds. Unlike traditional monitoring, Hacronics’ approach weaponizes raw telemetry data for six-sigma precision in load testing and fault isolation, turning production into a continuous QA lab.
Technical Insight 1: Precision Failure Detection with ML-Powered Root Cause Analysis
In Hacronics’ Observability-driven QA, machine learning categorizes failures by dissecting logs, traces, and metrics to pinpoint performance bottlenecks—whether from code, infrastructure, or saturation. Daily automated load tests in production capture raw response times (no aggregations), feeding BI dashboards like Tableau for percentile trends and Test Execution Scores. This enables 69% better MTTR, as teams correlate CPU/memory spikes with user paths via tools like AppDynamics, achieving proactive scalable architecture that handles global traffic spikes seamlessly. web.dev Core Web Vitals aligns perfectly here for user-centric metrics.
Technical Insight 2: SLO-Gated Deployments and Weekly Cluster Rebuilds for Reliability
Hacronics enforces performance optimization by tagging all data to the feature level and halting non-critical changes if SLOs dip, while weekly Kubernetes cluster teardowns build unbreakable recovery muscle. Traces optimize customer journeys, metrics drive automation, and logs fuel predictive analytics—yielding deep behavioral insights over time. This mirrors elite practices: statistically relevant signals from throughput/saturation deviations ensure measurable ROI, with production load tests revealing true app limits before users notice. For implementation, Microsoft Azure Well-Architected Framework provides scalable instrumentation guidelines.
Technical Insight 3: Full-Stack Visibility in Microservices and Load Testing
Why microservices demand observability? Hacronics exposes production health via real-time user monitoring, correlating distributed traces across clouds for instant fault domains—vital in hybrid environments. Load testing evolves with continuous telemetry: determine peak capacity pre-emptively, integrate AI for anomaly detection, and visualize resource utilization granularly. Exploratory QA thrives as testers query systems dynamically, uncovering issues invisible to traditional tests, directly boosting engagement by 25% through flawless UX.
Technical Insight 4: Predictive Analytics and GenAI for Proactive Scaling
Hacronics leverages GenAI for event-driven remediation and intelligent docs, balancing data granularity with costs via automated instrumentation and stakeholder dashboards. Predictive issue resolution spots degradations pre-impact, optimizing scalable architecture for growth—evident in reduced flakiness, faster MTTR, and pervasive security. This holistic view across builds, tests, and dependencies delivers elite DORA metrics with tangible measurable ROI.
Key Takeaway: Hacronics’ Observability-Driven QA Delivers Elite Performance
By embedding observability into QA from day zero, Hacronics turns guesswork into precision engineering—unlocking scalable architecture that deploys faster, recovers instantly, and engages users 25% more. This isn’t monitoring; it’s a resilient delivery engine yielding unmatched measurable ROI.
What is Observability-Driven QA?
Integrating logs, metrics, traces into testing for full visibility, enabling elite DORA metrics and 25% engagement gains via Hacronics innovations.
How does it boost user engagement?
Raw telemetry spots bottlenecks pre-user impact, ensuring sub-second responses and zero-downtime scaling for frictionless experiences.
Implementation Timeline?
Week 1: Instrument pillars. Week 2: Daily prod tests + dashboards. Month 1: SLO gates live—see ROI immediately.
Measurable ROI Evidence?
973x deploy frequency, 6570x faster recovery, 3x lower failures—proven in Hacronics client transformations.