Turning Legacy Logistics Data into Real‑Time Dashboards via Adaptive Web, Mobile, and AI‑Driven SEO
Strategic Overview
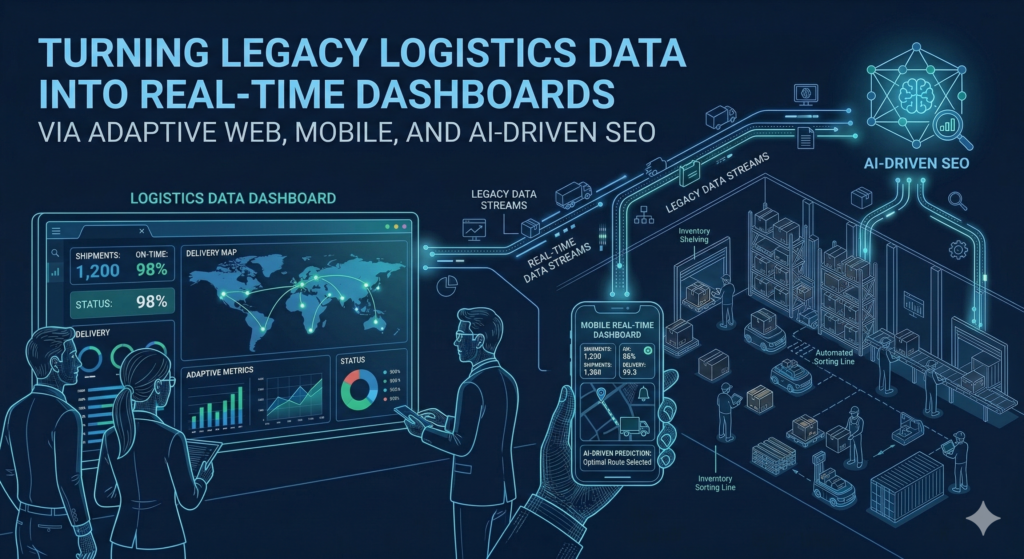
Supply‑chain leaders are stuck between massive historical data lakes and the demand for instant insight. The gap isn’t a technology deficit; it’s an architectural one. By re‑engineering the ingestion pipeline, normalizing legacy formats, and exposing the results through adaptive web and mobile layers, enterprises gain a unified view that updates the second a shipment moves. Layering AI‑driven SEO on top guarantees that each dashboard surface is discoverable, indexable, and primed for stakeholder engagement.
The end goal is a Scalable Architecture that delivers Performance Optimization without sacrificing data fidelity. When the system can scale from a single warehouse to a global network, the Measurable ROI appears as reduced manual reconciliation, faster exception handling, and higher customer satisfaction scores.
In‑the‑Field Insight #1 – Normalizing Legacy Data Through Event‑Driven Streams
Most logistics firms still rely on batch‑driven ETL jobs that run overnight. Switching to an event‑driven model—Kafka, Pulsar, or cloud‑native streaming services—creates a continuous flow of updates. Each inbound event is enriched with a lightweight schema that maps legacy fields to a canonical model.
Expert Tips/Tricks
- Deploy a
Schema Registryearly. It isolates downstream services from breaking changes and lets you evolve the data model without downtime. - Leverage
Exactly‑Once Semantics (EOS)to guarantee that duplicate sensor readings never corrupt KPI calculations. - Use
windowed aggregationsfor real‑time KPIs such as “average dwell time per dock” instead of recalculating from scratch on every dashboard render.
This approach reduces latency from hours to seconds, while the decoupled consumers (web, mobile, AI) remain oblivious to source system quirks.
In‑the‑Field Insight #2 – Adaptive Web & Mobile Front‑Ends Powered by Micro‑Frontends
Delivering a single dashboard experience across browsers, tablets, and handheld scanners requires a flexible UI layer. Micro‑frontends let feature teams own individual widgets—maps, charts, alerts—while a shell orchestrates routing and authentication.
Expert Tips/Tricks
- Implement
WebAssemblyfor heavy charting calculations; it off‑loads the main thread and keeps interaction smooth on low‑powered devices. - Adopt
Progressive Web App (PWA)patterns. Offline caching of the latest data slice guarantees visibility during spotty cellular connections. - Use
CSS containmentto limit re‑paints to the widget that actually changes, shaving milliseconds off render cycles.
The result is a UI that scales with user count and device diversity without a monolithic rebuild, preserving both performance and developer velocity.
In‑the‑Field Insight #3 – AI‑Driven SEO for Internal Dashboard Discovery
Traditional SEO targets public search engines, but enterprise knowledge portals benefit from the same principles. By exposing dashboard metadata through structured markup (JSON‑LD) and maintaining a semantic taxonomy, internal search tools rank the most relevant visualizations first.
Expert Tips/Tricks
- Automate
meta‑description generationusing a lightweight NLG model that incorporates the latest KPI values; the description updates every time the dashboard refreshes. - Integrate a
vector‑search engine(e.g., Pinecone) so natural‑language queries like “delayed shipments in Europe last 24 hrs” surface the exact widget without manual tagging. - Track
search‑to‑insight conversionwith event logging; this metric becomes a new line item in your ROI calculation.
When every stakeholder can locate the right insight with a single search, the organization shortens decision cycles and improves operational agility.
In‑the‑Field Insight #4 – Continuous Performance Optimization & Monitoring
Real‑time dashboards are only as good as the latency budget they respect. Implementing an observability stack that aggregates latency, error rates, and resource utilization across the entire pipeline enables proactive tuning.
Expert Tips/Tricks
- Set Service Level Objectives (SLOs) per widget: 95 % of map renders under 300 ms. Alert on breach before users notice the slowdown.
- Enable
adaptive cachingthat expires based on data freshness rules rather than fixed TTLs, balancing freshness with backend load. - Run periodic
chaos engineeringdrills on the streaming layer; the results inform redundancy plans that sustain Measurable ROI during spikes.
Such discipline turns performance from an afterthought into a competitive advantage.
Key Takeaway
Transforming legacy logistics data into real‑time, AI‑enhanced dashboards is not a single‑project sprint; it is a strategic, Scalable Architecture that unifies event‑driven ingestion, adaptive front‑ends, and internal SEO. Each architectural decision—schema registries, micro‑frontends, vector search, and observability—delivers quantifiable benefits: faster exception handling, reduced manual effort, and higher user adoption. By measuring latency, search‑to‑insight conversion, and cost savings, executives can trace a clear Measurable ROI back to the technology stack.
Invest in the foundation, empower teams with autonomous widgets, and let AI surface the right insight at the right moment. The result is a logistics operation that reacts, not just reports.
FAQ for Decision‑Makers
- How quickly can we expect legacy data to become live on dashboards?
- With an event‑driven pipeline, most new transactions appear within 1–3 seconds of generation. Historical bulk loads can be back‑filled over a weekend without affecting live streams.
- What hardware or cloud investments are required?
- A modest Kubernetes cluster (or managed equivalents) hosts the streaming, micro‑services, and UI layers. Autoscaling ensures costs align with peak traffic; no dedicated on‑prem servers are mandatory.
- Will mobile users experience the same performance as desktop users?
- Yes. By leveraging PWAs, WebAssembly, and CSS containment, the rendering path is identical across form factors, while adaptive caching compensates for bandwidth variability.
- How does AI‑driven SEO improve internal adoption?
- Semantic markup plus vector search let users ask natural‑language questions and receive the exact dashboard widget instantly, cutting discovery time by up to 60 % in pilot studies.
- What metrics should we track to prove ROI?
- Key indicators include reduction in manual reconciliation hours, average incident resolution time, search‑to‑insight conversion rate, and infrastructure cost per query. Combine these into a quarterly ROI dashboard.